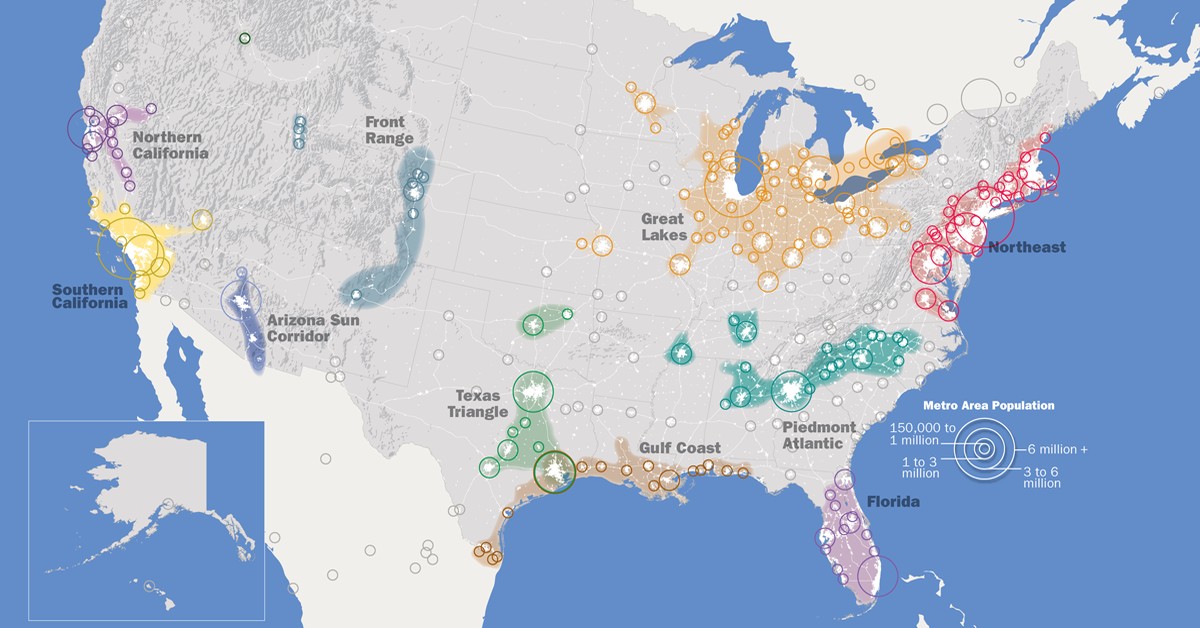
Created by the Regional Plan Association, this map shows the 11 US megaregions – clustered networks of American cities, with an estimated population exceeding 237 million. More than 70 percent of the nation’s population and jobs are located in these megalopolises.

In terms of their estimated population in 2025 they rank in the following order: (population in 2010)
- Great Lakes: 60.7 million (55.5 million) – includes Chicago, Toronto, and Detroit
- Northeast: 58.4 million (52.3 million) – includes New York, Boston, Philadelphia and Washington
- Southern California: 29 million (24.4 million) – includes Los Angeles, San Diego and Las Vegas
- Texas Triangle: 24.8 million (19.7 million) – includes Houston, Dallas, San Antonio and Austin
- Piedmont Atlantic: 21.7 million (17.6 million) – includes Atlanta
- Florida: 21.5 million (17.3 million) – includes Miami, Orlando, and Tampa Bay
- Northern California: 16.4 million (14 million) – includes San Francisco, San Jose and Oakland
- Gulf Coast: 16.3 million (13.4 million) – includes Houston and New Orleans
- Cascadia: 13.5 million (12.4 million) – includes Vancouver. Seattle and Portland
- Arizona Sun Corridor: 7.8 million (5.6 million) – includes Phoenix
- Front Range: 6.9 million (5.5 million) – includes Denver
Sources: Wikipedia, Brilliant Maps